Recommended Blogs

Blog
Observability That Drives Trust – Building Cloud-Native Systems for Enterprise Success
Table of Content
- Why Observability for Cloud-Native Apps?
- Core Pillars and Technologies of Cloud-Native Observability
- Best Practices to Build a Robust Observability for Cloud-Native Apps
- How to Choose the Right Tools and Technologies?
- Foster a Culture of Observability
Share On


As businesses build more complex systems, keeping track of how everything is working can feel like a juggling act. Traditional monitoring tools only give you a glimpse of isolated data, but what you really need is the full picture and a clear view of how your applications are performing in real time. That’s where observability comes in.
Unlike basic monitoring, observability gives you a deeper understanding of your system’s health by bringing together logs, metrics, and traces. This lets you spot potential issues before they become big problems, fix them faster, and keep things running smoothly, even as your applications grow more complex.
Observability is essential for enterprises looking to stay ahead and remain resilient. By adopting an observability strategy, you can proactively manage your systems, reduce downtime, and create better experiences for your users.
In this blog, we will explore why observability is so important for cloud-native apps, how it can transform your business operations, and the tools that make it all possible.
Why Observability for Cloud-Native Apps?
Unlike traditional monitoring, which only shows you isolated pieces of data, observability gives you a full view of how your applications behave in real time. By capturing everything from logs and metrics to detailed traces, teams can spot potential problems early, fix issues faster, and keep things running smoothly even in complex environments built on microservices and containers.
As per a report by Cloud Native Computing Foundation, 85% of enterprises have out microservices to use. Adopting an observability strategy means you are not just reacting to issues but anticipating them. With real-time insights, your DevOps teams can work smarter together, catching anomalies before they become outages. And with AI and automation in the mix, manual troubleshooting takes a back seat, freeing teams to focus on innovating and improving. In the fast-moving world of cloud-native apps, observability is the tool that helps organizations stay agile, reduce risks, and deliver a knockout experience to customers.
Core Pillars and Technologies of Cloud-Native Observability
To build an effective observability cloud-native apps strategy, it is vital to understand the core pillars and technologies that support it. Cloud-native observability goes beyond traditional monitoring and provides a comprehensive view of everything that happens inside the application and infrastructure.
Foundational pillars of observability include:
1. Metrics
These are the numbers that give you a pulse on your system’s health, think CPU load, response times, or memory in use. By tracking these figures over time, teams can catch trends and spot trouble before it escalates.
2. Logs
Imagine logs as the running diary for your apps. Every warning, error, or odd event gets recorded, making it much easier to retrace steps when you’re fixing a glitch or just trying to understand what happened.
3. Traces
Traces act like a map, showing exactly how a user’s request moves from one microservice to another. They come in handy for pinpointing the slow spots or dependencies in sprawling, distributed environments.
Emerging pillars of observability include:
1. Profiling
This takes things a step further, digging into performance details so you know not just that something is off but why and how deep the issue goes, beyond log entries or metric spikes.
2. End-User Monitoring
At the end of the day, what matters is the actual experience for your users. This pillar keeps you tuned in to how the system feels from their side, so you’re not just solving backend mysteries, you’re ensuring a smooth ride for everyone.
Technologies that support cloud-native observability include:
1. Metrics
- Prometheus: This is one of the most popular open-source tools used for monitoring and alerting, especially in Kubernetes environments. It collects real-time time-series data and helps identify performance issues early.
- Grafana: A widely used visualization tool that takes metrics from Prometheus and other sources to create interactive and intuitive dashboards for better understanding and decision-making.
2. Logs
- Fluentd: An open-source data collector that unifies logs from different sources, making it easier to manage and analyze logging data in one place.
- Elasticsearch: A powerful search and analytics engine designed to process and analyze large volumes of log data quickly, supporting complex queries and insights generation.
3. Traces
- Jaeger and Zipkin: These distributed tracing systems visualize and analyze the flow of requests as they move across different microservices. This helps developers understand dependencies and pinpoint bottlenecks or failures within complex cloud-native applications.
4. OpenTelemetry
This open-source project is a game-changer for observability. It standardizes instrumentation, data collection, and export for metrics, logs, and traces. By offering a unified approach, OpenTelemetry makes it easier for teams to gather comprehensive telemetry from their systems without vendor lock-in.
Best Practices to Build a Robust Observability for Cloud-Native Apps
Building a strong observability strategy requires thoughtful planning and intentional actions. The following best practices offer guidance on how to set up your observability efforts for long-term success, balancing thoroughness with efficiency and aligning technology with your team’s workflows and business goals.
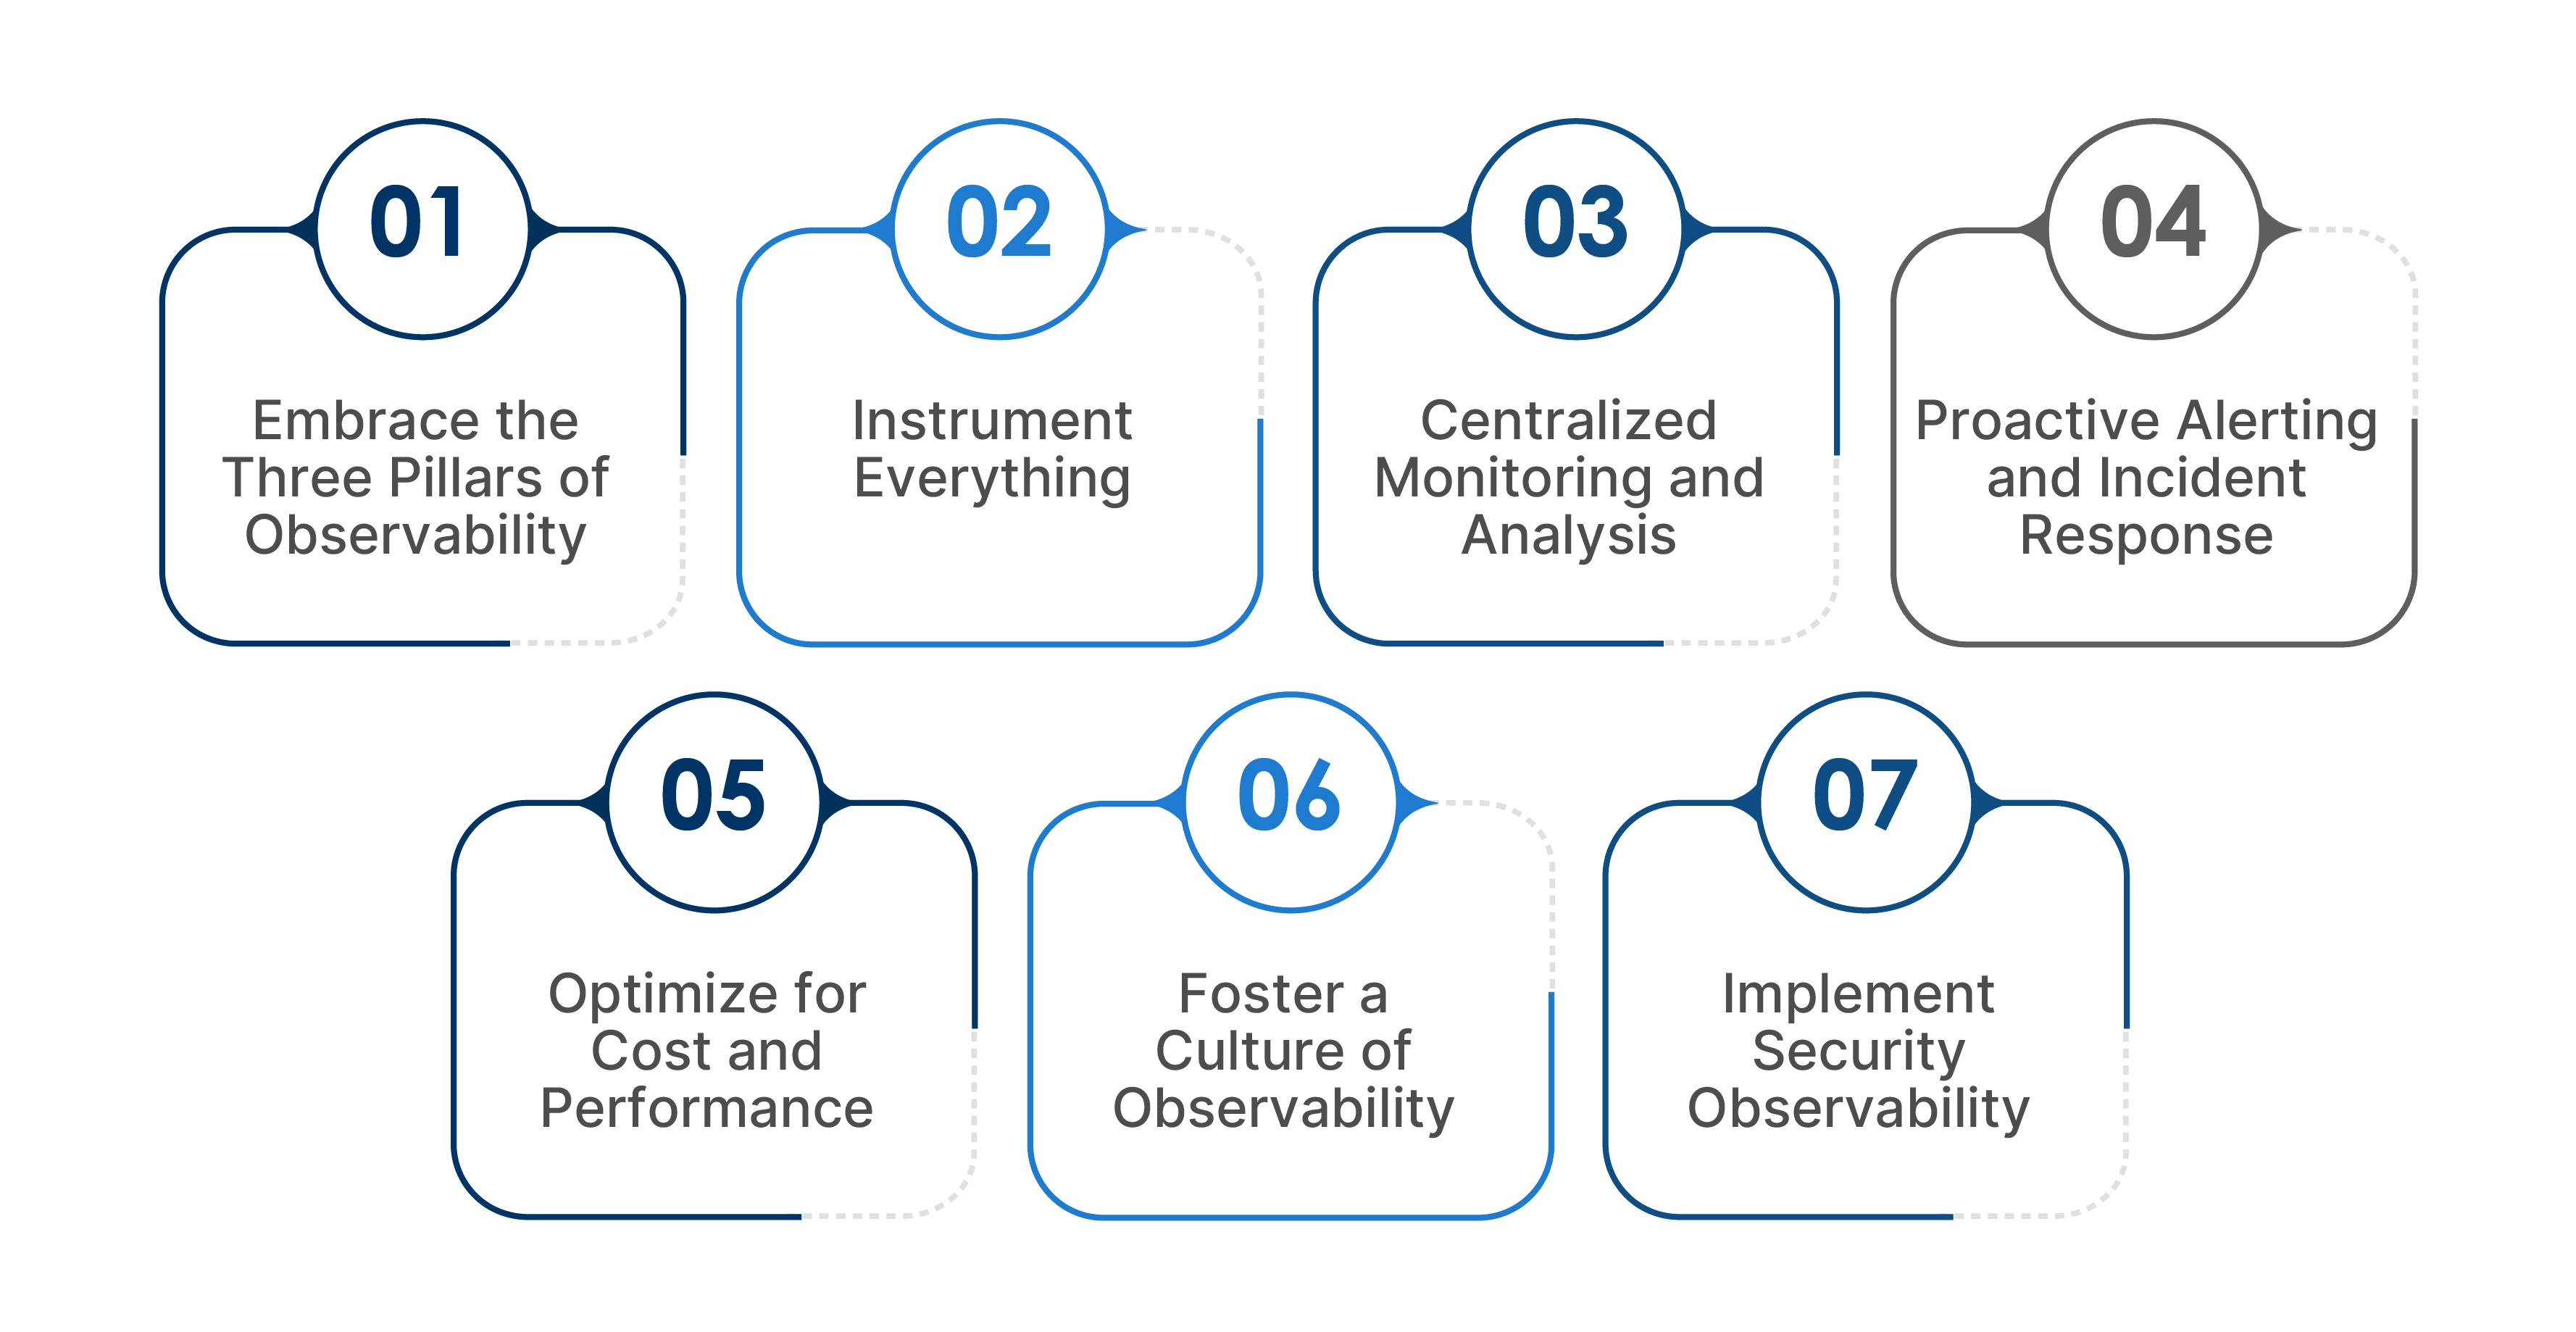
1. Embrace the Three Pillars of Observability
Start by collecting comprehensive data from logs, metrics, and traces. Logs offer a detailed history of events and errors, making troubleshooting much easier. Metrics provide a numeric snapshot of system performance, like CPU usage and error rates, revealing trends at a glance. Traces map the complete journey of requests through microservices, helping find bottlenecks and dependencies. Using tools like Prometheus for metrics, Grafana for visualization, and Jaeger for tracing ensures you get these insights in a well-structured way.
2. Instrument Everything
Your applications and infrastructure must be thoroughly instrumented to produce the necessary logs, metrics, and traces to get the full picture. This means not only coding observability into your apps but also ensuring under-the-hood systems like container runtimes and Kubernetes components are monitored. Open standards like OpenTelemetry help standardize data collection across all your distributed systems, avoiding vendor lock-in and keeping your setup flexible.
3. Centralized Monitoring and Analysis
All telemetry data should be aggregated into a single platform so teams can easily visualize and analyze the health of the entire cloud-native environment. This “single pane of glass” approach simplifies spotting trends, detecting anomalies, and identifying warning signs before problems escalate. Dashboards and interactive visualization tools make it straightforward to interpret large data volumes and focus on what really matters.
4. Proactive Alerting and Incident Response
Set up alerts based on careful thresholds and anomaly detection to catch issues early—before they impact users. Notifications should be meaningful, giving your team clear context for fast diagnosis and resolution. Having well-defined incident response procedures ensures problems are managed efficiently and don’t snowball, helping keep your systems reliable and uptime high.
5. Optimize for Cost and Performance
Observability itself should strike a balance between comprehensive data collection and cost-effectiveness. Continuously adjust what you collect and store to avoid needless expenses while keeping critical insights available. Focus on granular data for key components where precise monitoring impacts performance and reliability, and prune lower-value telemetry to save on storage and processing costs.
6. Foster a Culture of Observability
Observability is most effective when everyone like developers, operators, security teams sees its value and actively participates. Educate teams on why observability matters and how to use tools confidently. Embed observability thinking throughout the development lifecycle so it doesn’t become an afterthought but a continuous discipline that drives improvements in reliability and innovation.
7. Implement Security Observability
Security is a vital dimension of observability. Integrate monitoring for security-related logs, metrics, and traces to spot vulnerabilities and threats early. By extending your observability strategy to include security telemetry, you gain deeper insights into suspicious behavior and can respond faster to protect the system and data.
How to Choose the Right Tools and Technologies?
Selecting the right observability tools is a crucial step that can make or break the success of your observability strategy. Here are key factors to consider when evaluating and choosing tools:

Define Your Goals and Understand Your Setup
Before you start looking at tools, get clear on what you want to achieve, whether it’s cutting downtime, boosting performance, or tightening security, make sure you know your environment well: which cloud providers you use, your container orchestration platforms like Kubernetes, and the programming languages powering your apps. This knowledge helps narrow down the tools that will fit smoothly.
Ensure All Key Data Types Are Covered
Look for tools that can handle all the important forms of telemetry: logs for detailed event tracking, metrics to monitor system health, and traces that follow a request as it moves through your distributed services. Having good coverage across all three means you won’t miss important insights.
Check for Integration, Scalability, and Intelligence
Your chosen tools should easily connect with your cloud environment and programming languages. They need to scale gracefully as your telemetry volume grows, without bogging down your systems. Smart features like AI-driven anomaly detection and root cause analysis can lighten the load on your teams. Do not forget user-friendly dashboards and alerting systems, as these help your team stay informed and react quickly.
Consider the Ecosystem and Support
Decide if you prefer open-source tools like Grafana, which offers flexibility and no vendor lock-in, or commercial platforms like Datadog, which provide all-in-one solutions with strong vendor backing. Using standard frameworks such as OpenTelemetry can make mixing and matching tools easier and avoid being tied down.
Choose Between an All-in-One Platform or Modular Tools
You can go with an integrated platform covering all your observability needs in one place, simplifying management and offering seamless visibility. Alternatively, a modular approach lets you pick best-of-breed tools to fit specific needs, giving you more flexibility but possibly more complexity. Think about your team’s skills and what fits your operations best.
Foster a Culture of Observability
Creating a strong culture around observability is just as important as the technical tools and processes you implement. It’s something that needs to be embraced by everyone, from developers to operations and security teams. When all these groups understand the value observability brings and how to use the tools effectively, it becomes part of the daily workflow rather than an afterthought.
Making observability a regular part of software development from the very start helps ensure visibility is baked into every stage, from design to deployment. When teams see firsthand how observability helps catch issues early, speeds up troubleshooting, and ultimately leads to happier users, they become invested in improving and maintaining good practices.
As a leading partner for DevOps observability services, our experts at TxMinds help enterprises create the right observability strategy for cloud-native apps. From improving visibility and transparency to reducing operational costs, data-driven decision-making, and elevated customer satisfaction, we work towards helping clients achieve their business goals. Book your consultation with our industry leaders for a strategic roadmap.


Amar Jamadhiar
VP, Delivery North America
Amar Jamadhiar is the Vice President of Delivery for TxMind's North America region, driving innovation and strategic partnerships. With over 30 years of experience, he has played a key role in forging alliances with UiPath, Tricentis, AccelQ, and others. His expertise helps Tx explore AI, ML, and data engineering advancements.
FAQs
What is the difference between monitoring and observability?
-
Monitoring is the process of gathering predefined sets of metrics and logs to answer known questions. Whereas observability is the ability to understand the internal state of a system and answer unknown questions after examining its outputs.
Why is observability so important for cloud-native applications?
-
Observability provides necessary context to quickly understand system behavior, troubleshoot issues, and enhance reliability without depending on traditional monitoring. Cloud-native apps’ complexity makes it difficult to predict every possible failure, hence observability is crucial to tackle it.
What is OpenTelemetry?
-
OpenTelemetry is an open-source standard for instrumenting software in order to generate and export telemetry data like metrics, logs, and traces. It gives a vendor-agnostic way to gather data and helps avoid vendor lock-in.
How does observability fit into DevOps and CI/CD?
-
Integrating observability into your CI/CD pipeline helps catch performance and reliability issues earlier in the development process. With a clear and shared view of system health, it enables developers and operations teams to collaborate effectively and reduce MTTR.
Discover more